
The free NYFI shows you the trade. NYFI PRO shows you your lane. Subtrade and port-pair indices, history from 2023, futures curves and supply-and-demand analytics help you benchmark your rates and decide when to fix and when to ride the market.
Every Friday, shippers, NVOCCs and carriers check the NYSHEX Freight Index (NYFI) to see where the market moved. Because NYFI is built on rates for cargo that actually shipped, not quotes or surveys, it has become the preferred benchmark behind index-linked contracts and the container freight futures and options that trade on ICE.
But a trade-wide average only takes you so far. Asia to US West Coast is not one rate: South China to Los Angeles, North China to Seattle and Southeast Asia to Oakland each move on their own. If you buy or sell freight on a specific lane, the question you need answered is: what is the market doing on my lane, and what should I do about it?
That is what NYFI PRO is built for. This blog explains what the NYFI PRO product adds to the free NYFI index, how it helps you benchmark your rates and time your contracting decisions.
NYFI vs. NYFI PRO at a glance
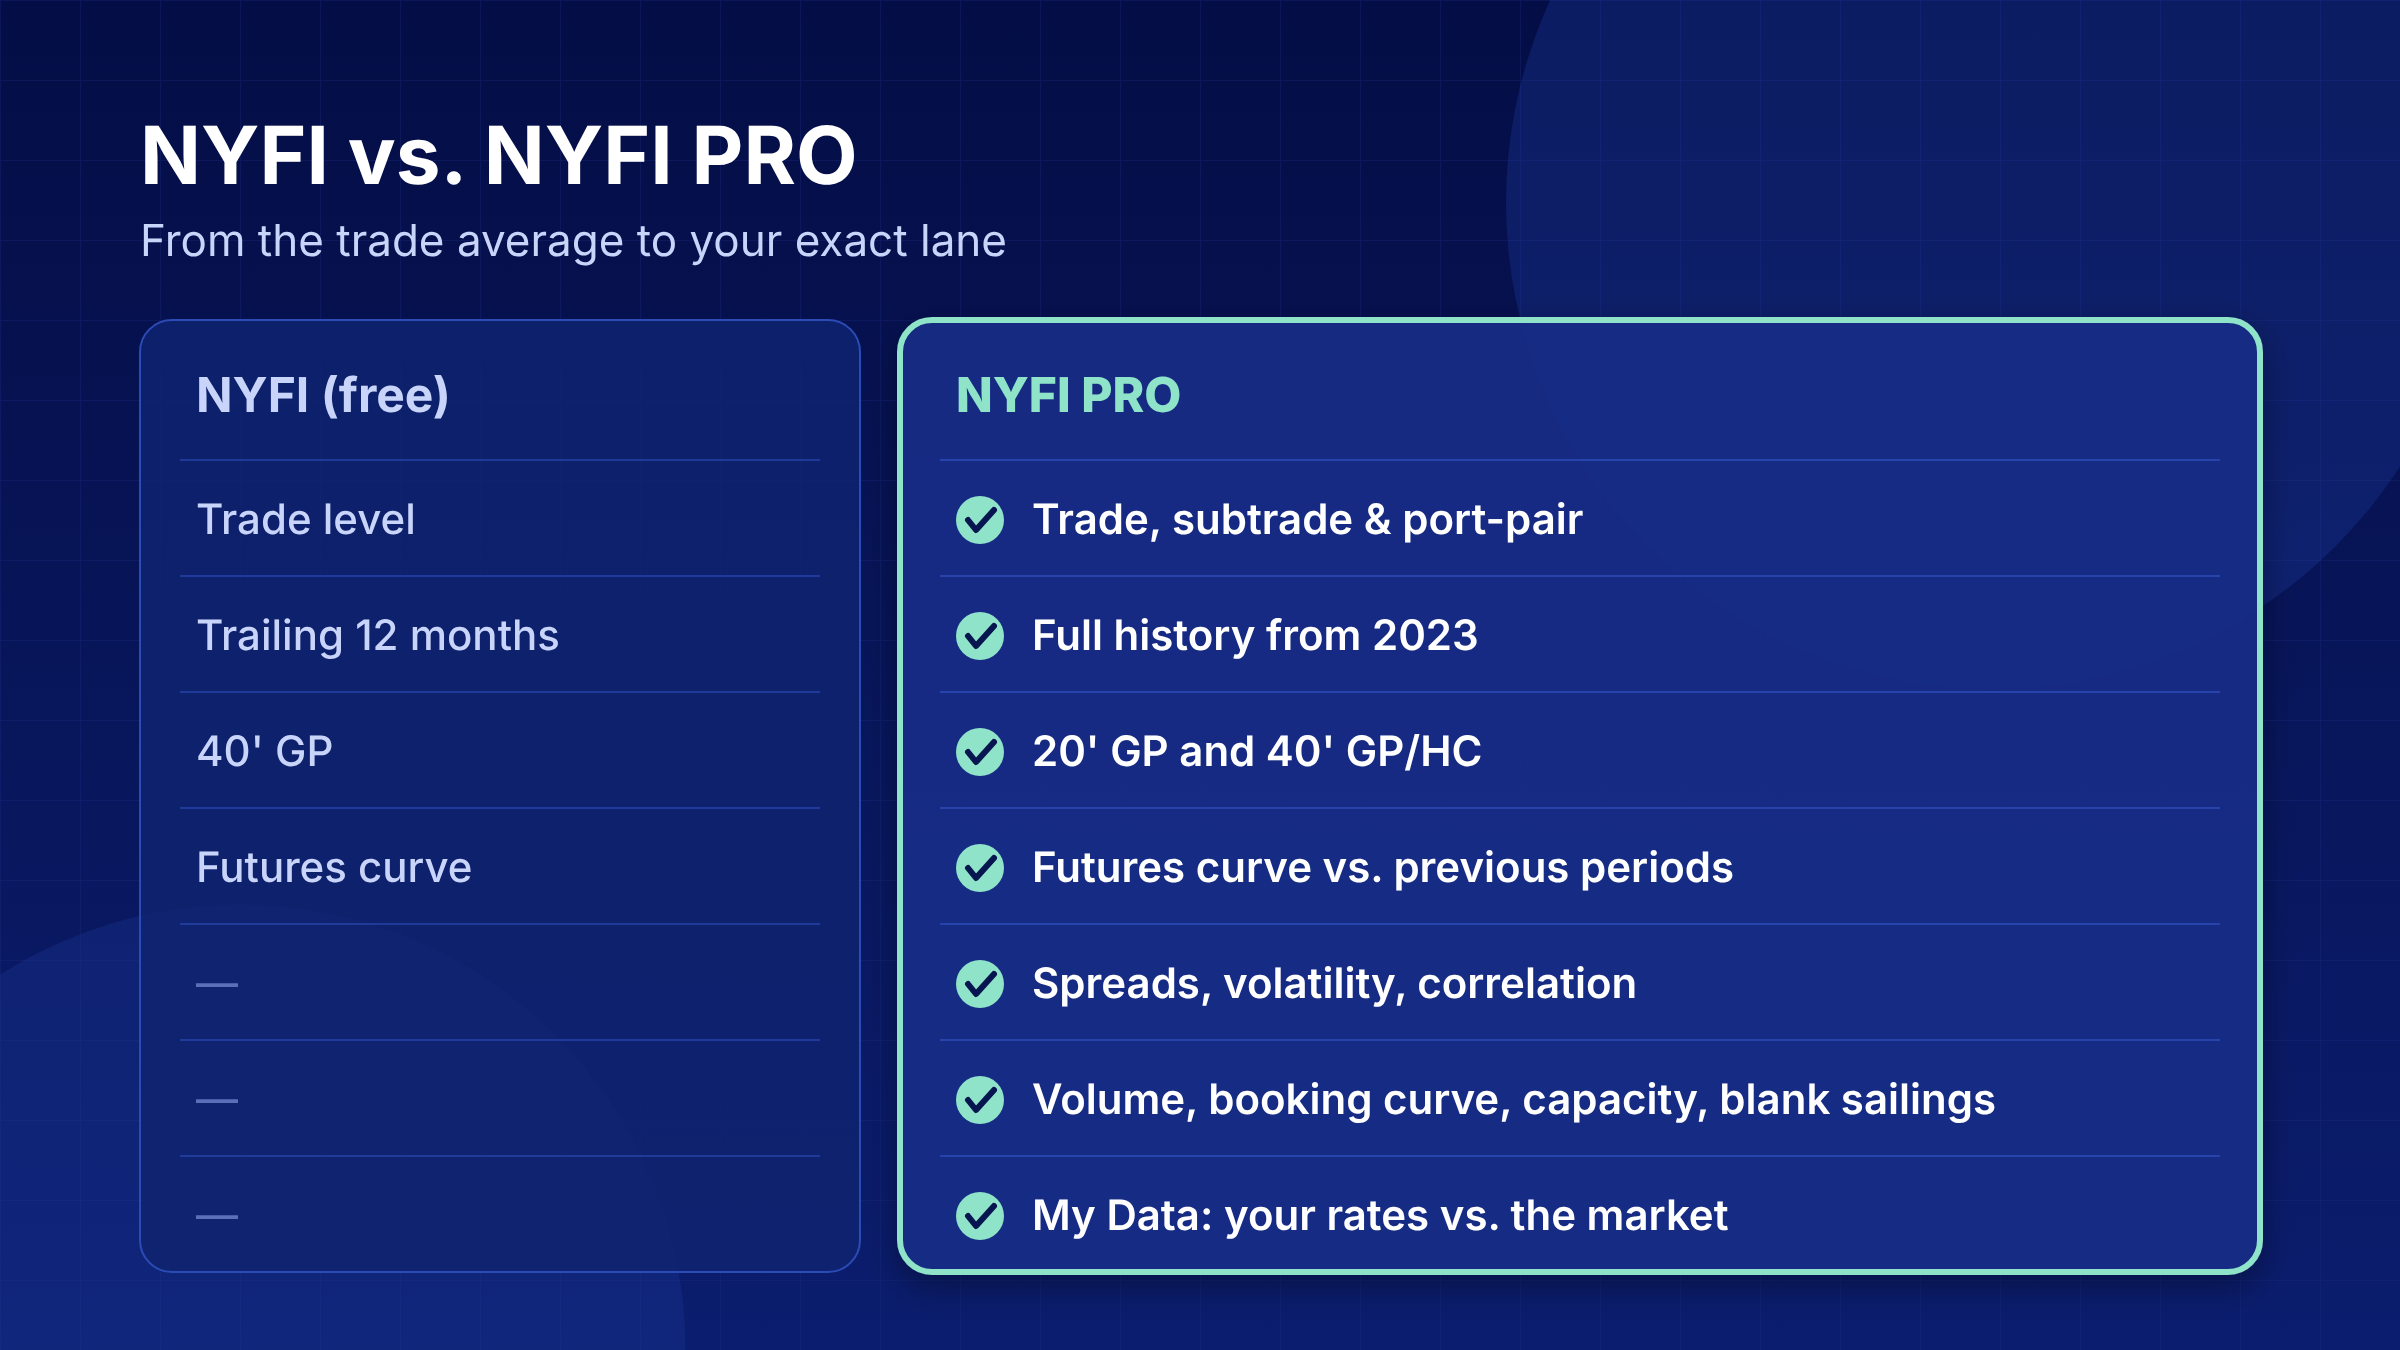
The free NYFI gives you a trade-level view of the market. NYFI PRO takes that view down to the lanes you actually ship and adds the history, analytics and forward signals you need to act on it:
Are your freight rates competitive?
Most teams know what they pay. Far fewer know where that rate sits against the market on the same lane, this week. As we covered in How to Know if Your Ocean Freight Rates Are Still Competitive, getting three quotes isn't benchmarking, and a rate that looked good in April can look very different by October.
NYFI PRO closes that gap in three ways:
-
-
-
Lane-level precision. Subtrade and port-pair indices let you compare like with like, instead of measuring a South China to Los Angeles rate against a whole-trade average.
-
Context over time. History back to 2023 shows how today's rate compares with last quarter, the last peak season and the last contracting cycle.
-
The right box. Indices for both 20' and 40' containers mean you benchmark the equipment you actually ship.
-
-
The result: you walk into a carrier or customer negotiation with a fact base, not an opinion.
Is now the right time to lock in rates?
Fix now, or ride the market? It's the question procurement and pricing teams face every contracting cycle, and the answer is rarely obvious. NYFI PRO gives you four lenses on it:
-
-
-
Volatility. How much has your lane been swinging? On a volatile lane, a fixed rate is worth more as insurance. On a calm one, staying on index or spot costs less.
-
Rate spreads. The gap between subtrades, port pairs and container sizes shows where pricing is out of line, and where you have room to negotiate.
-
Correlation. See which lanes move together, so you can tell whether a move on one trade is likely to reach yours.
-
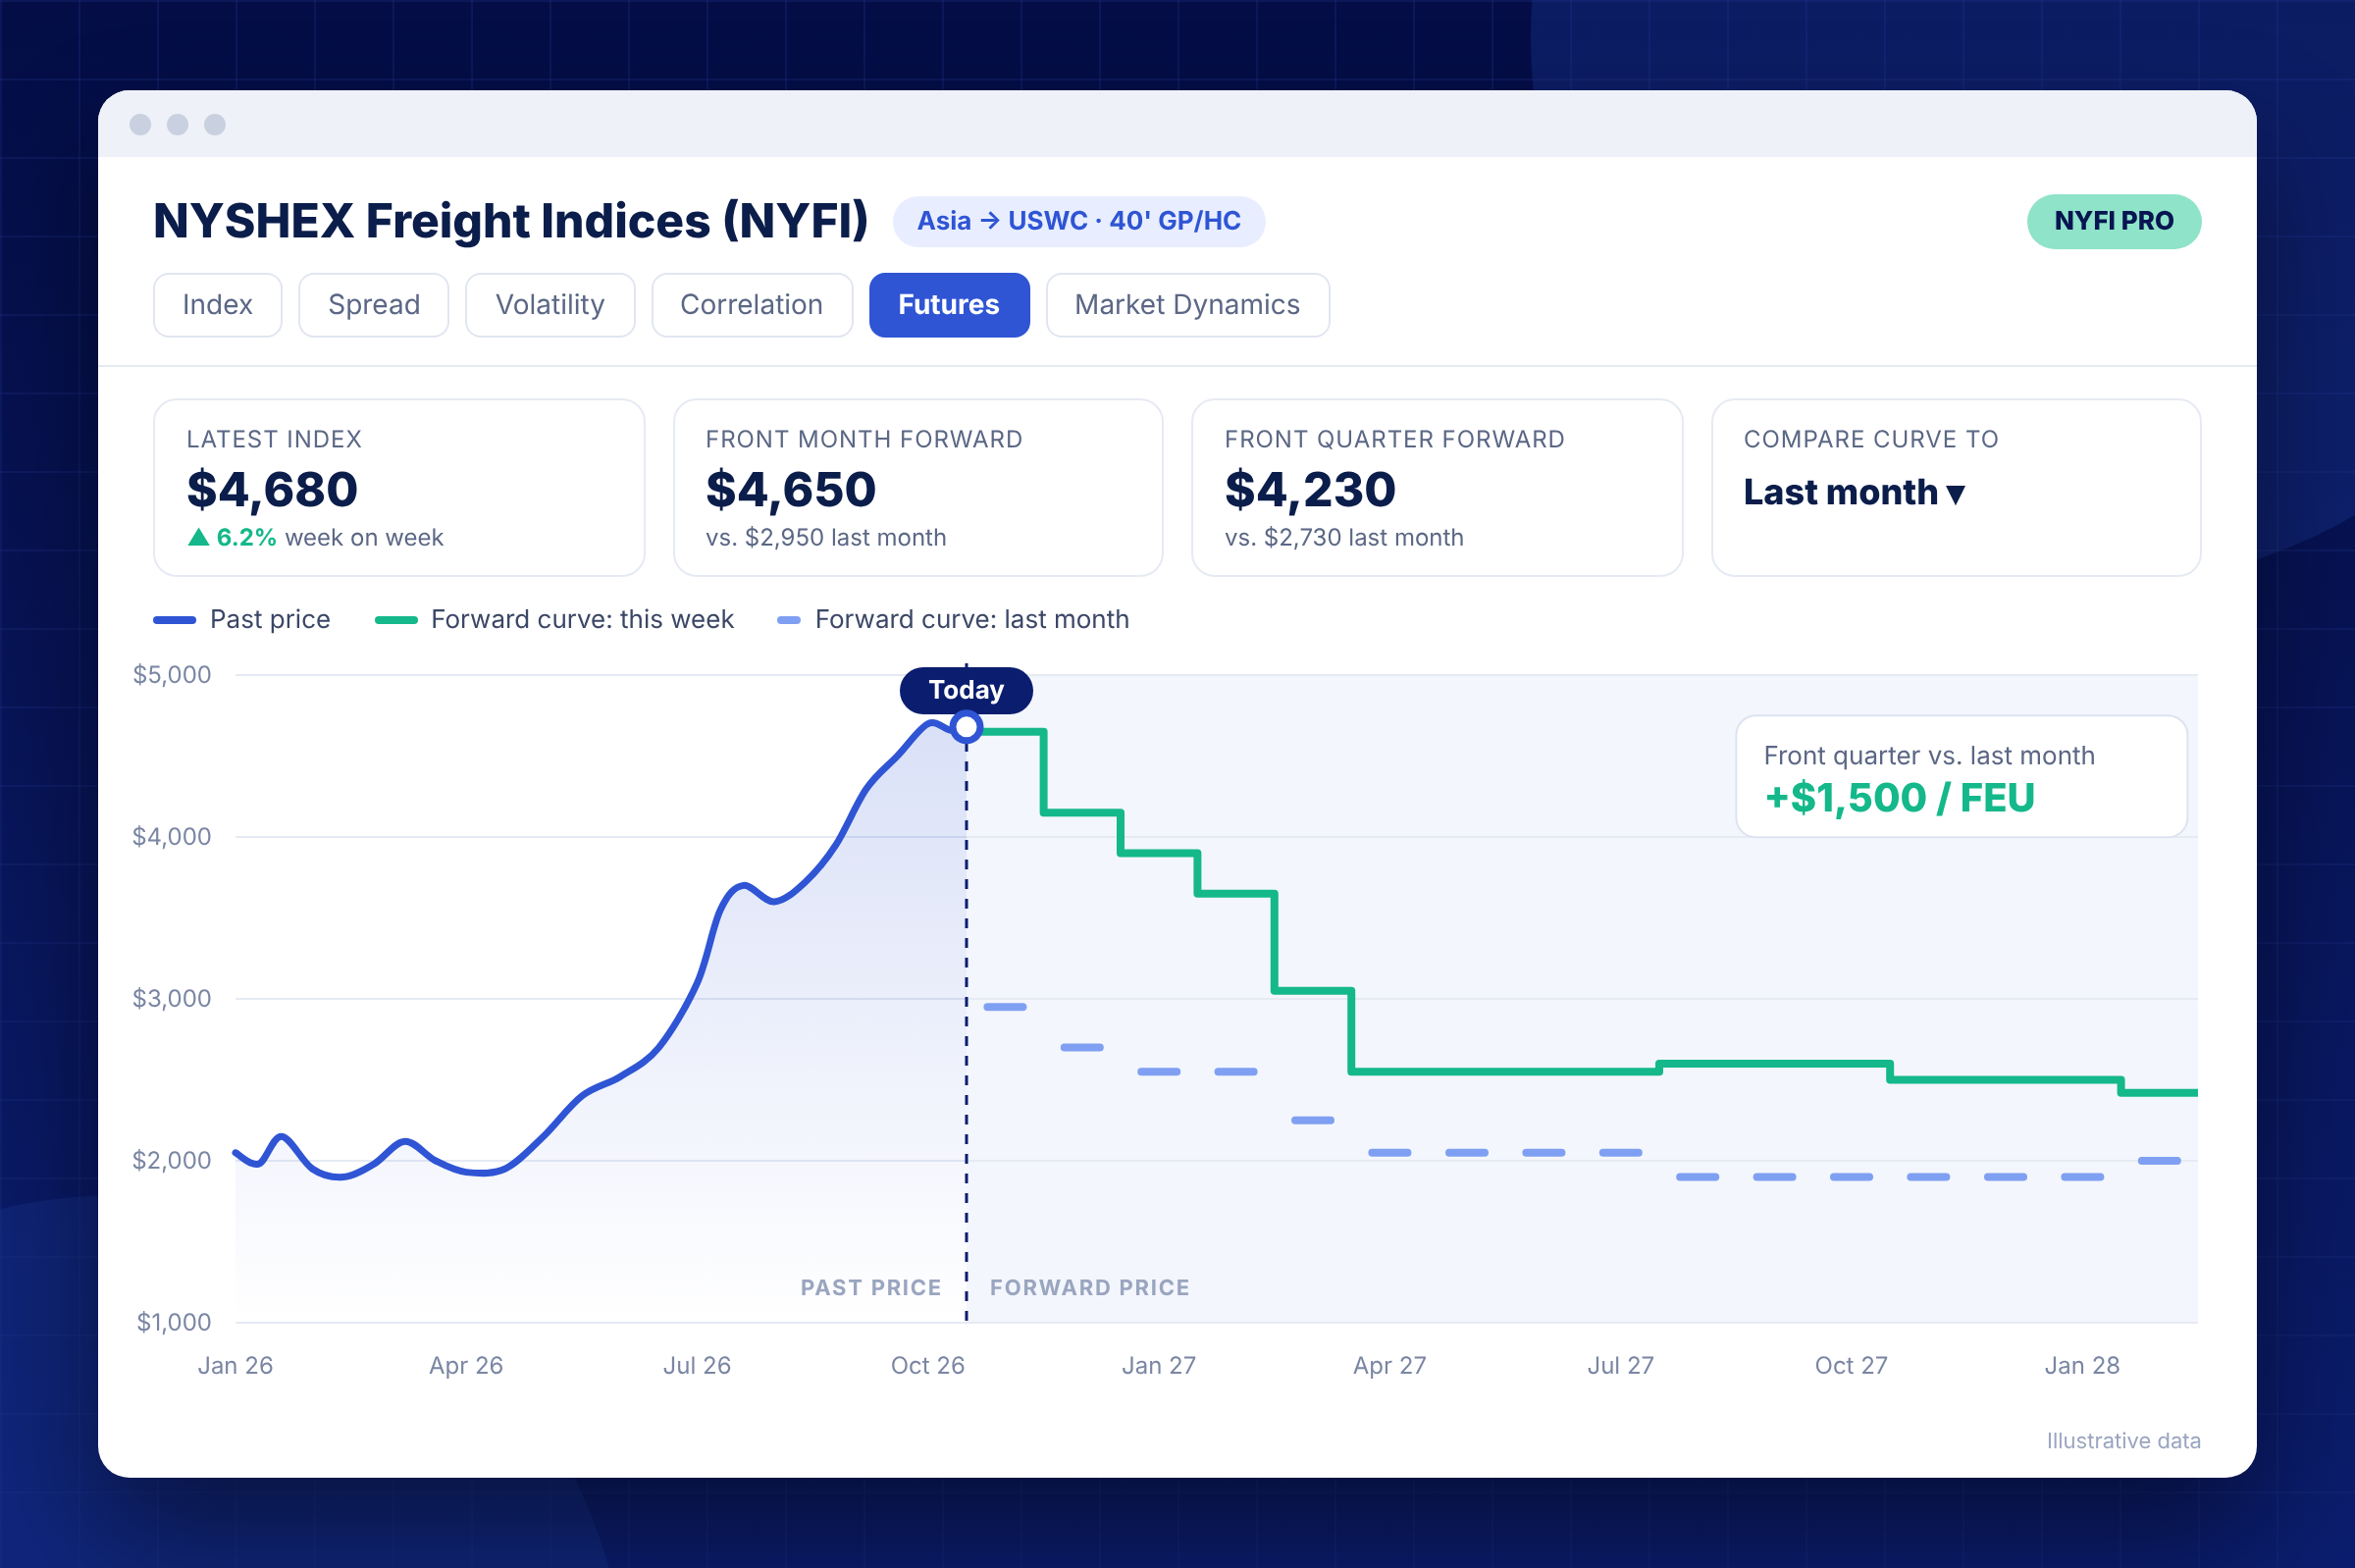
Futures curve vs. previous periods. Since NYFI futures and options began trading on ICE, the market's forward expectations are visible. NYFI PRO shows the curve and how it has shifted since last week or last month, a direct read on whether sentiment is hardening or softening.
-
-
Together, these turn a gut call into a structured decision: how much volume to fix, how much to index-link and how much to leave on spot.Why it matters for the container freight derivatives market
What could happen next?
Spot rates describe the present. They typically trail shifts in supply and demand by weeks, which is why rate increases so often feel like they arrive without warning. As we explained in Capacity Data Is the Rate Signal Most Teams Miss, the earlier signals sit in capacity and bookings.
NYFI PRO brings those signals into the same view as the index:
-
-
-
Market volume. How much cargo is actually moving on the trade.
-
Booking curve. How far ahead cargo is being booked, and how full forward sailings already are.
-
Capacity and blank sailings. How much space carriers are offering, and how much they are pulling.
Rising bookings into falling capacity point to a tightening market. The reverse points to a softening one. Seeing both next to your lane's index helps you act before the next rate move, not after it.
-
-
Personalized benchmarking with My Data
Market data is most useful when you can set it against your own. With the My Data feature, NYFI PRO overlays your weekly actual moving rates on the market index for the same lane. You can see at very concretely where you are paying above market, where you are below it, and how that gap has moved over time.
Who NYFI PRO is for
-
-
-
Shippers and BCOs: Procurement and logistics teams who want to test contract competitiveness, time tenders and build a fact base for carrier negotiations.
-
NVOCCs and forwarders: Pricing teams who need to price customers off the real market on each lane and protect margin when rates move.
-
Carriers: Commercial and pricing teams who want a transaction-based view of the market on the lanes they sell.
-
Analysts: Anyone who needs history, granularity and forward signals in one place.
-
-
Getting started
Trying NYFI PRO takes one step, contact Yanzhi Hu if you are curious to get a test drive. Or, get free access first, then ask us to upgrade.
The market average tells you where the trade is. NYFI PRO tells you where your lane is, where it has been since 2023, and what the forward signals say about where it's heading.
NYFI is published weekly, every Friday at 10:00 ET, based on rates for cargo shipped in the previous week. Lane examples in this article are illustrative.
Want to compare plans first? See what's included in NYFI PRO.
NYFI is published weekly, every Friday at 10:00 ET, based on rates for cargo shipped in the previous week. Lane examples in this article are illustrative.
This article is for general information only and is not investment advice. Trading futures and options involves risk, including the loss of the premium paid.
This article is for general information only and is not investment advice. Trading futures and options involves risk, including the loss of the premium paid.
Want to see how an index-linked contract with a hedge would have performed on your lanes? Simulate your contract with NYFI here.
Want to see how an index-linked contract with a hedge would have performed on your lanes? Simulate your contract with NYFI here.
Want to see how an index-linked contract with a hedge would have performed on your lanes? Simulate your contract with NYFI here.
Want to see how an index-linked contract with a hedge would have performed on your lanes? Simulate your contract with NYFI here.
Want to see how an index-linked contract with a hedge would have performed on your lanes? Simulate your contract with NYFI here.
Want to see how an index-linked contract with a hedge would have performed on your lanes? Simulate your contract with NYFI here.
Want to see how an index-linked contract with a hedge would have performed on your lanes? Simulate your contract with NYFI here.
Why it matters for the container freight derivatives market
Why it matters for the container freight derivatives market
Why it matters for the physical market
Illustrative figures only. They exclude brokerage, clearing fees and margin, and do not reflect actual NYFI levels or option prices.
• A call option protects against rising rates. It pays out if NYFI settles above the agreed level. The natural buyers are those who pay for freight and want protection against rising rates: shippers, BCOs and NVOCCs buying capacity.
• A put option protects against falling rates. It pays out if NYFI settles below the agreed level. The natural buyers are those who sell freight and want protection against falling rates: carriers, and NVOCCs selling at market-linked prices.
Two numbers define every option. The strike price is the NYFI level where protection starts. The premium is what you pay upfront for that protection. A strike close to today's market rate gives more protection and costs more. A strike further away costs less and only pays out on a bigger rate move, much like choosing the deductible on an insurance policy.
Consider an illustrative example of an options hedge. A European importer ships 300 FEU a month from Asia to North Europe on an index-linked contract that moves with NYFI, so its freight bill rises and falls with the market. It has a Q1 freight budget of $3,000 per FEU, or $2.7 million for the quarter. To protect that budget, it buys call options with a $3,000 strike and pays a premium of $150 per FEU. If rates spike and NYFI settles at $4,200, the importer pays $4,200 under its contract, the option pays the $1,200 difference above the strike, and the net cost is $3,150 per FEU: the strike plus the premium. That's $945,000 less than the unhedged bill. If rates soften and NYFI settles at $2,400, the option expires unused, and the importer pays $2,400 plus the $150 premium, a net $2,550 per FEU, well under budget. Either way, the worst case was known on the day the option was bought.
Want to see how an index-linked contract would have performed on your lanes? Simulate your contract with NYFI here.
Want to see how an index-linked contract would have performed on your lanes? Simulate your contract with NYFI here.
Why fixed rates break